


Walking through a small hardware store last month, I watched the owner carefully arrange paint cans — premium brands at eye level, house brands below, specialty finishes up top. Three weeks later, the same gallons were still sitting in the same spots while the paint mixer ran out of basic white three times. This is the inventory turnover problem most owners don't want to face: it's not too much inventory, it's the wrong stuff in the wrong spots moving at the wrong speed. Most small stores sit on roughly $180k–$220k in inventory and turn it 4 times a year when 6–7 turns are realistic, leaving about $40k–$50k tied up in slow stock that shouldn't occupy prime shelf space.
Contractors and DIY customers create very different demand patterns for the same SKU. A contractor buys in bulk predictably; a homeowner buys randomly. Pure velocity analysis misses context like the occasional low-velocity SKU that prevents a customer from driving to a competitor. The right approach balances velocity with strategic value.
Why traditional shelf planning fails hardware stores
Standard shelf planning organizes by category, brand, or season and treats similar SKUs equally. That ignores how products actually move: two screw SKUs can have wildly different velocities but get identical space.
The result: fast movers get buried, slow movers occupy prime facings, and frequent contractor purchases or one-off homeowner buys aren't handled appropriately.
The velocity bands framework
-
Band A (Daily Movers)
SKUs that sell multiple units every day; allocate ~40% of shelf space.
-
Band B (Weekly Movers)
SKUs that sell several times per week; allocate ~35% of shelf space.
-
Band C (Monthly Movers)
SKUs that sell slowly but consistently; allocate ~20% of shelf space.
-
Band D (Quarterly Movers)
Long tail and special-order items; allocate ~5% of shelf space or consider delisting.
The power comes from mapping these bands to physical placement, not just percentages. Concentrate Band A items in prime facings and treat Band D as special-order or backroom stock.
Stop losing sales due to inventory gaps.
Hardzly helps you manage stock levels, orders, and supplier interactions efficiently.
- Unified inventory and sales tracking
- Supplier and purchase order management
- Automated workflow and task scheduling
No credit card required
Paint department velocity mapping
-
Band A
Basic white (flat/eggshell/semi-gloss), primer, top two or three local neutrals.
-
Band B
Common colors (navy, black, light gray), ceiling paint, exterior white.
-
Band C
Bold colors, specialty finishes, trim paint, concrete/garage paints.
-
Band D
Custom mixed returns, discontinued colors, ultra-specialty products.
Don't spread these evenly. Put all fastest movers in a 4-foot chest-height zone near the paint desk so restocking is fast and stockouts are visible.
Space-per-SKU rules and reorder formulas
Use facings to link physical space to demand: Shelf facings = (Weekly velocity × Lead time in weeks) / Units per facing. Apply judgment when rounding and use safety stock only for Band A items.
Formulas
Safety Stock = Average Weekly Demand × Safety Buffer Weeks
Reorder Point = (Average Weekly Demand × Lead Time in Weeks) + Safety Stock
Example: A SKU averaging 14 units weekly with a 1-week lead time and a 2-week safety buffer needs 28 units safety stock (14 × 2) and triggers reorder at 42 units [(14 × 1) + 28].
| Velocity Band | Demand Pace | Safety-Stock Heuristic | Order-Up-To Level | Pack-Size Rounding Rule |
|---|---|---|---|---|
| Band A | Daily | 2 weeks demand | Lead time demand + 2 weeks buffer | Round up to full master carton |
| Band B | Weekly | 1 week demand | Lead time demand + 1 week buffer | Round to nearest vendor pack |
| Band C | Monthly | 0.5 weeks demand | Lead time demand + review cycle | Round down to individual eaches |
| Band D | Quarterly | 0 weeks (special order) | Customer-requested quantity | Do not order store backup stock |
Calculate reorder thresholds using our Fasteners & Paint Replenishment Template: Fasteners & Paint Replenishment Template.
Worked examples: Paint (Band A white gallons) selling 14 weekly with 1-week lead and 4/gal per facing: safety stock 28, reorder at 42 gallons; round shortfalls to master-case quantities.
Fasteners example: Drywall screws selling 100 boxes weekly with 1-week lead and 10/box per carton: safety stock 200, reorder at 300 boxes; round to full cartons.
For implementation guidance see Cleverence's retail inventory guide.
Fastener aisle optimization
Fasteners often reveal the biggest wins: ~20% of SKUs frequently drive ~75% of fastener sales. Reorganize facings by velocity and treat low-velocity specialty sizes as special-order items.
-
Band A fasteners
#8×1.5" drywall screws, #10×2.5" deck screws, common nail sizes, basic wood screw multipacks.
-
Band B fasteners
Specialty deck screws, concrete anchors, common machine screw sizes, finish nails.
-
Band C/D fasteners
Brass screws, stainless specialty sizes, metric items, decorative hardware — move to special-order.
Place Band A at waist-to-chest height in double-wide bins with backup stock at arm's reach. Put Band C/D in a special-order area with samples and a catalog QR code.
Seasonal velocity complications
Seasonal items change bands by month; treat them as 'velocity migrants' and migrate placement on a schedule rather than dedicating permanent seasonal space.
-
January (Band A)
ice melt, snow shovels, heating supplies.
-
January (Band D)
grass seed, fertilizer, garden hoses.
-
July (Band A)
garden hoses, fertilizer, insect spray.
-
July (Band D)
ice melt, snow shovels, heating supplies.
Physically migrate seasonal SKUs by month: backroom in low season, Band C as demand rises, Band A during peak months. Use Band A overflow/endcap space for seasonal surges.
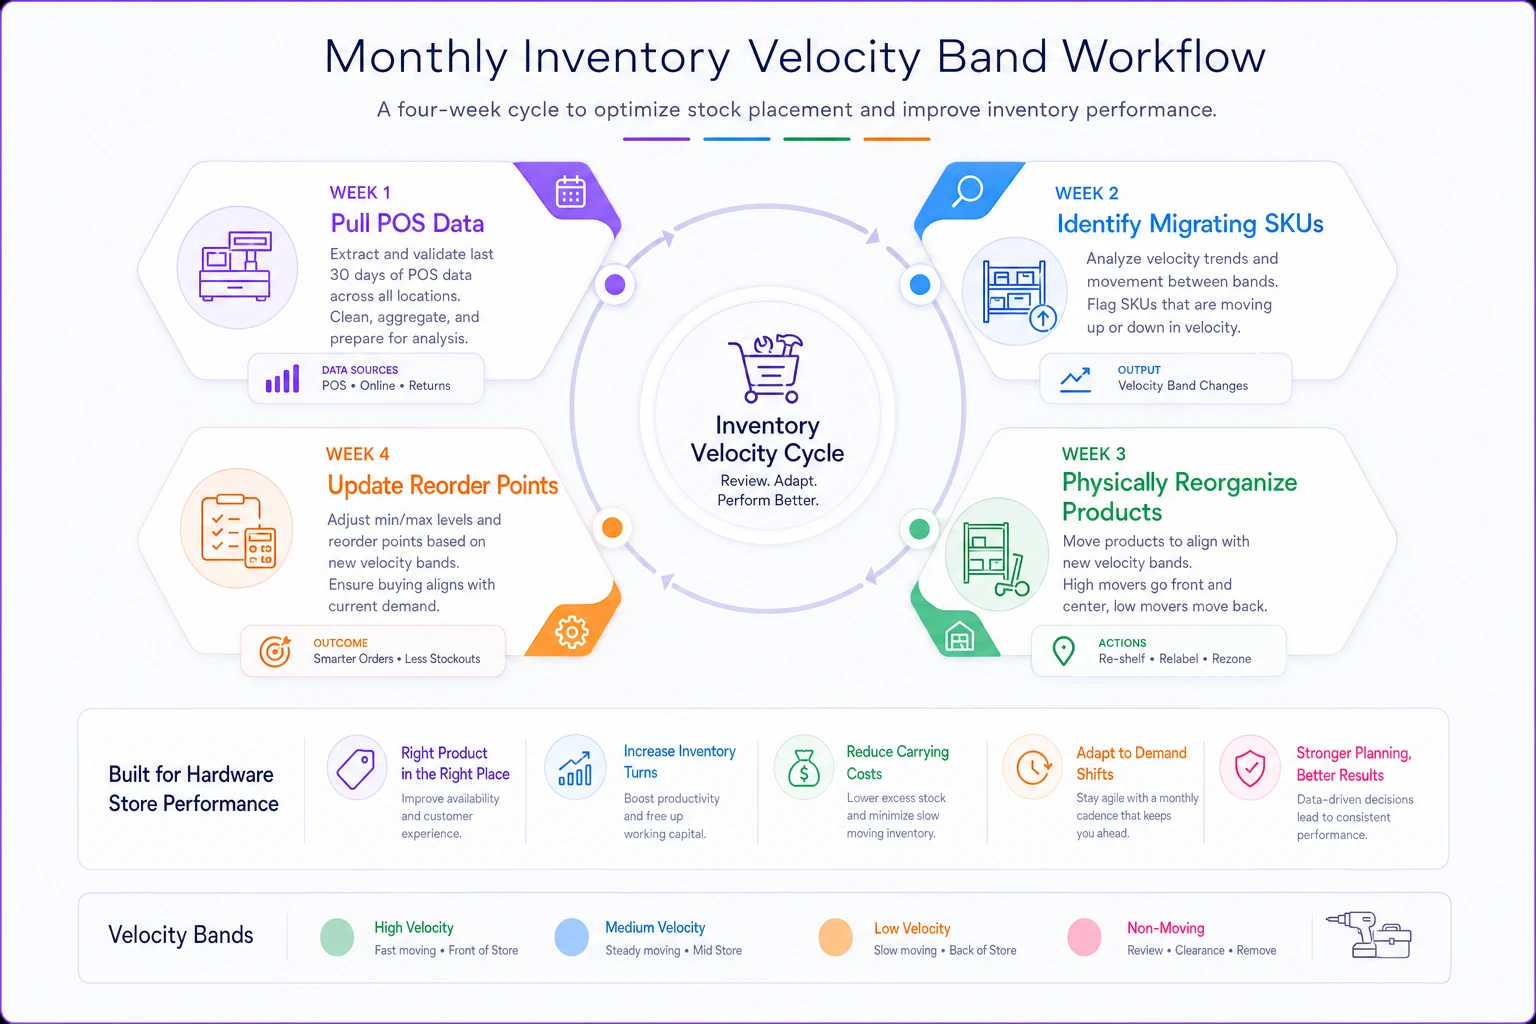
The monthly action cadence
-
Week 1
Export POS data for the past 90 days and calculate weekly velocity per SKU.
-
Week 2
Identify migrants—SKUs that shifted bands and require attention.
-
Week 3
Physically reorganize identified SKUs (block ~2 hours on a slow morning).
-
Week 4
Update reorder points and safety stock levels based on new band assignments.
Monthly migration typically moves 5–10% of SKUs. Doing the physical work is where most stores fail—set a recurring reminder and own the execution.
Signs your velocity bands are off
-
Chronic stockouts in specific sections (Band B items in Band A space).
-
Dead inventory accumulating 180+ days in prime placement.
-
Customer complaints about locating common items.
-
Reorder frequency mismatches (Band C reordered weekly or Band A reordered monthly).
The math that makes this worth it
Example baseline: $200k inventory, 4 turns/year, 30% gross margin. Velocity banding can free about $20k from slow stock and redeploy it into fast movers.
If redeployed capital turns 12–15 times annually, that $20k can generate roughly $60k more revenue at 30% margin—about $18k in additional gross profit.
Reducing stockouts on fast movers (even by half of the typical 3–5% lost sales) is another $15k–$25k on a $1M revenue store. Combined, $30k–$40k in extra profit is realistic without buying more inventory.
Technology and practical automation
Monthly velocity analysis is doable manually but tedious. POS exports plus spreadsheets work, but they get skipped. AI or operational software automates classification, migration alerts, and location-specific banding.
-
Automated classification surfaces SKUs that shifted bands each month.
-
Seasonal migration recommendations can be triggered before demand spikes.
-
Multi-location systems handle location-specific Band A/B/C differences automatically.
Starting Monday morning
-
Pick one department (paint or fasteners) to pilot.
-
Pull 90 days of POS data for that department and classify SKUs into bands.
-
Map current Band A SKUs and identify scattered placements.
-
Concentrate Band A items in a 4-foot prime section and move Band D to poor facings or special-order.
-
Set a monthly reminder to repeat the cadence and track turns.
Within 30 days expect fewer stockouts on fast movers; within 60 days slow-moving inventory should drop; within 90 days department turns often improve by ~20% or more.
Admitting most SKUs don't deserve equal space is uncomfortable, but necessary. The 100 SKUs that drive your business deserve prime facings; the rest can be special-order or relegated. This isn't about carrying less inventory—it's about having the right inventory in the right place turning at the right speed.
Start small, run the monthly cadence, and use the replenishment template if you want a ready-to-use spreadsheet and CSV companion to compute ROP, safety stock, order-up-to levels, and suggested order quantities for each SKU.
Ready to elevate your hardware store management?
Join 500+ hardware stores using Hardzly to boost operational efficiency, reduce stockouts, and grow revenue.