



Most independent hardware stores don't have a merchandising problem. They have a merchandising stage — and they're stuck on it. Shelves get restocked, endcaps get swapped when a rep pushes something, and pricing gets tweaked when a customer complains. It works well enough to keep the lights on. But "well enough" is exactly what keeps blended margin capped around 34-38% when it could realistically sit north of 42%.
The reason it stays capped is that merchandising decisions live in someone's head — usually the owner's — and that person is also running receiving, covering the counter at lunch, and chasing a late paint order. There's no system underneath the decisions, so the store never gets better at merchandising in any repeatable way. It just reacts.
This piece lays out a five-stage maturity ladder so you can figure out where you actually are, what the next rung looks like, and how to climb it over 6-18 months without betting the store on a big remodel or an expensive planogram consultant. Each stage has a milestone checklist, a measurement template, and a rough investment threshold — because the whole point of a maturity model is that you shouldn't try to jump from Stage 1 to Stage 5. You earn each rung.
Why merchandising stalls at "good enough"
The pattern that shows up across small stores: merchandising quality is inversely tied to how busy the owner is that month. Good spring, and nobody touches the layout because everyone's slammed. Slow February, and suddenly there's energy to reset the fastener aisle. The store's merchandising literally improves only when sales are bad — which is backwards.
The deeper issue is that merchandising blends three things most owners treat as separate chores: space (what goes where and how much room it gets), price (markup and promo), and assortment (what you carry at all). When those three aren't governed together, you get the classic symptoms — a slow-moving category eating four feet of prime eye-level shelf, a hot SKU stuck on the bottom rack, and promos that move units but quietly torch margin.
What breaks as you grow isn't the individual decisions. It's the coordination. A store doing $900k a year can survive on the owner's memory. At $1.6M with two people making buying and layout calls, the memory system collapses — two people can't share a gut feel. That's when you need decisions written down as rules, and that's really what climbing this ladder means: converting instinct into rules, then rules into experiments.
The five stages at a glance
The table below maps each stage by how decisions actually get made, what happens to margin, and roughly what it costs to operate at that level. Worth scanning before diving into the detail — it makes it easier to spot which stage you're actually at versus which one you think you're at.
Stop losing sales due to inventory gaps.
Hardzly helps you manage stock levels, orders, and supplier interactions efficiently.
- Unified inventory and sales tracking
- Supplier and purchase order management
- Automated workflow and task scheduling
No credit card required
| Stage | Name | How decisions get made | Margin behavior | Rough monthly investment |
|---|---|---|---|---|
| 1 | Ad-hoc | Gut feel, rep-driven | Unpredictable, drifts down | ~$0 (time only) |
| 2 | Documented | Written markup bands + layout map | Stops leaking | $0-100 |
| 3 | Measured | Category-level margin & sqft tracking | Slow steady lift | $100-300 |
| 4 | Governed | Scheduled resets, rules enforced by role | Consistent, defensible | $300-600 |
| 5 | Experiment-led | A/B tests drive layout & price changes | Compounding lift | $500-1,200 |
The mistake that comes up most often is stores that think they're at Stage 4 because they have a nice planogram from a supplier. A planogram you didn't measure and don't enforce is decoration. If you can't tell me what changed in margin-per-square-foot after the last reset, you're at Stage 2 with good-looking shelves.
Stage 1 — Ad-hoc: where almost everyone starts
At this stage merchandising is reactive. Endcaps reflect whatever the last rep pushed. Markups are inconsistent even inside a category — you'll find two similar caulk tubes at 28% and 51% margin sitting side by side because they were priced two years apart.
-
You can't state your target margin by category from memory
-
Your layout has never been drawn on paper or a screen
-
Nobody besides you knows why a product is where it is
-
Promo pricing has no floor — "make it move" is the whole strategy
The milestone to leave Stage 1 is embarrassingly simple: write down what you currently do. Not what you should do — what you actually do. Draw your floor on one page. List your categories and eyeball their current markup. This baseline is what you'll measure everything against later, and skipping it is why so many stores can't prove their improvements are real.
Measurement template for Stage 1: a single spreadsheet with columns for Category, Approx. Shelf Feet, Estimated Margin %, and a "Prime/Secondary/Dead zone" tag for location. Fill it in rough. Precision comes later.
Stage 2 — Documented: turning instinct into rules
This is the highest-ROI jump on the whole ladder and costs almost nothing. You take the gut feel and write it as bands.
The core artifact is a category markup band table — fasteners at 45-55%, paint at 38-44%, power tools at 22-30%, seasonal at 40-60% because it has to carry its own deadstock risk. Now anyone pricing an item has guardrails, and the two-caulk-tubes problem stops happening on new receipts.
The second artifact is a written floor map with location tiers. You designate which shelves are prime (eye level, near the main path), which are secondary, and which are dead zones. Once that's on paper, you can start asking the uncomfortable question: is the category sitting in prime space actually earning it?
If you want a deeper treatment of governing space, price, and promos together at this stage, the small-store merchandising system for space, pricing and promos walks through the mechanics.
Stage 2 milestone checklist:
-
[ ] Markup bands documented for every category
-
[ ] Floor map drawn with prime/secondary/dead tiers labeled
-
[ ] A one-page "why it's here" note for your top 10 categories
-
[ ] Promo floor rule written (e.g., "never below cost + 15%")
Investment threshold: basically zero. A spreadsheet and an afternoon. If you're spending money to reach Stage 2, you're overcomplicating it.
Stage 3 — Measured: attaching numbers to space
Stage 2 gives you rules. Stage 3 tells you whether the rules are any good. The unlock here is margin-per-square-foot, not margin percentage. A category can have a gorgeous 55% margin and still be a loser if it turns twice a year and hogs six feet.
A typical example: a store's plumbing fittings wall was margin-percentage healthy at around 48%, but when you divided gross margin dollars by shelf feet occupied, it was generating maybe $180 per foot per quarter. The adjacent electrical section, at a "worse" 39% margin, was doing closer to $310 per foot because it turned three times faster. Fittings weren't bad — they were over-spaced. Trimming two feet and giving it to electrical lifted the whole run's contribution without changing a single price.
That's the game at Stage 3: measure contribution per unit of space, then reallocate. The full framework for turning a mixed floor into margin-per-sqft winners is worth reading before you start cutting feet — there are real traps around cutting depth on categories that anchor customer trips — and the category governance playbook for margin-per-sqft covers those.
Measurement template for Stage 3 — run this quarterly per category:
-
Pull gross margin dollars for the category over the quarter
-
Measure linear (or square) feet it occupies
-
Divide dollars by feet → your margin-per-foot number
-
Rank all categories
-
Flag the bottom quartile for space reduction, top quartile for expansion
Manual tracking quickly becomes a burden; here's a simple workflow to keep the quarterly process running without taking days.
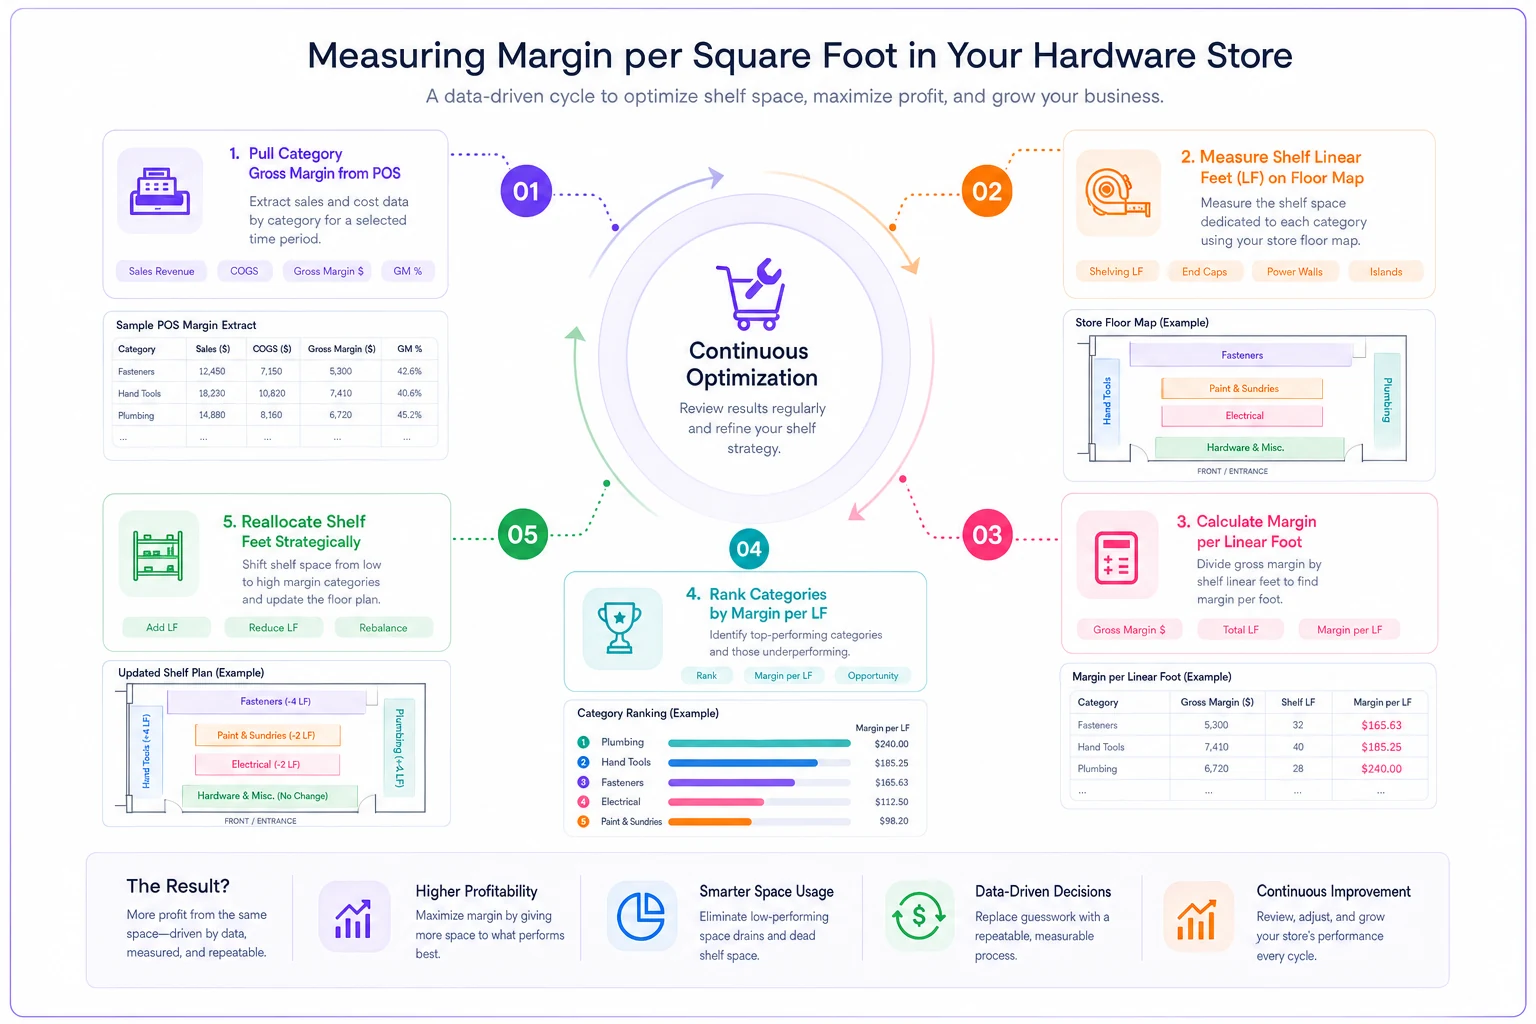
Use this as a checklist when you run the quarterly review.
Investment threshold: $100-300/month range, mostly for whatever keeps your product and margin data in one queryable place.
Stage 4 — Governed: enforcement by role, not by owner
A lot of stores quietly slide backwards here. They reach Stage 3, make smart reallocations, and then six months later the floor has drifted right back because there was no cadence holding it in place. A rep restocked an endcap with the wrong SKU, a part-timer faced up a dead category into prime space, and nobody caught it.
Stage 4 means the rules from Stage 2 and the measurements from Stage 3 become someone's actual job, on a schedule.
When this actually makes sense: you have at least two people making merchandising-adjacent decisions (buying, receiving, layout), and you're above roughly $1.2-1.4M in revenue where the owner can no longer personally see every shelf every week.
Who should NOT do this yet: a true single-operator store doing under $800k. If it's just you, governance is overhead — you are the governance. Don't build a review committee of one.
The governance layer usually looks like:
-
A monthly 45-minute merchandising review using the Stage 3 rankings
-
A quarterly full reset with a printed checklist so it's not from memory
-
Clear role ownership
who can change a price, who can change space, who can add a SKU
-
A short "drift log" where staff note anything that got moved and why
Keep a short 'drift log' visible near the receiving area so crew can note small moves in real time rather than relying on memory at the monthly review.
The thing most owners miss: governance isn't about control, it's about repeatability. A governed store can hand the merchandising review to a manager and get the same quality of decisions. An ungoverned store loses all its merchandising instinct the day the owner takes a vacation.
Investment threshold: $300-600/month, and importantly, real payroll time. Budget the review hours or it won't happen.
Stage 5 — Experiment-led: making the shelf earn its keep
The top rung is where changes stop being opinions and start being tests. Instead of "let's move the drill batteries to the endcap," it's "let's move drill batteries to the endcap for three weeks, hold everything else steady, and compare units and margin against the prior three weeks."
Low-cost experiments that actually fit a small store:
-
Endcap A/B same category, two different hero SKUs, alternate weekly, measure sell-through
-
Price elasticity nudge raise one mid-tier category's price band by 3-4%, watch units for a month — most non-commodity hardware barely flinches
-
Adjacency test move a complementary category next to an anchor (sandpaper beside the paint) and measure attach rate
-
Prime-space swap rotate a Stage-3 top-ranked category into your best endcap and measure the lift against the category it replaced
The discipline that separates Stage 5 from "just trying stuff" is one variable at a time and a control period. If you change space and price and the season all at once, you learn nothing. Stores that get this right run maybe two or three small experiments a quarter — not because more isn't possible, but because each one needs enough time to produce a clean result.
A realistic experiment template:
-
Hypothesis (one sentence)
"Moving fasteners to eye level lifts fastener margin dollars 10%+"
-
Control period
prior 3 weeks, same days-of-week
-
Test period
next 3 weeks, single variable changed
-
Metric watched
category margin dollars + units
-
Decision rule set in advance
keep if lift >8%, revert if flat or negative
Investment threshold: $500-1,200/month, largely in the tooling that makes measuring test-vs-control fast enough that you'll actually finish the analysis.
A real scenario: climbing two rungs in a year
A single-location store in a small trade town, doing around $1.3M, was solidly Stage 1 — rep-driven endcaps, pricing all over the place. Blended margin sat near 35%.
The first two months went to Stage 2: documented markup bands and drew the floor. That alone caught a batch of underpriced electrical accessories and a seasonal category priced with no deadstock buffer. Blended margin ticked up to around 37% just from fixing pricing drift on reorders.
Months three through eight they built the Stage 3 quarterly margin-per-foot review. The plumbing-over-electrical reallocation described earlier was theirs — they pulled roughly two feet from three slow categories and handed it to faster ones. By month ten, blended margin was hovering around 40-41%, and turns on the reallocated space had noticeably improved.
They did not reach Stage 5 in the first year — and that's the honest part. They tried a couple of endcap experiments but didn't hold the variables steady, so the results were muddy. What they got right was not skipping rungs. The Stage 2 documentation is what made Stage 3 measurement possible, and the measurement is what made the reallocations defensible instead of arguments.
How the stages actually connect
The temptation is to treat these as a checklist you complete and abandon. They're not. Each stage keeps running while you add the next. Documentation (Stage 2) has to stay current or your measurements (Stage 3) reference bands nobody follows. Measurement has to feed governance (Stage 4) or the reviews have no data. Governance is what keeps experiments (Stage 5) honest, because you can't run a clean test on a floor that drifts every week.
That's the whole reason this is a maturity model and not a project plan. A project ends. A merchandising system compounds — a Stage 4 store makes better decisions every quarter than it did the last, because it's measuring, and a Stage 5 store makes better decisions than it knew how to make, because it's testing assumptions instead of defending them.
Where to start this week
If you're honest that you're at Stage 1 or 2, don't map out an 18-month transformation. Do the boring baseline first: draw your floor on one page, eyeball your category margins into a spreadsheet, and write down your markup bands as they actually are today. That single afternoon is the foundation every other rung sits on, and it's the step most stores skip because it feels too simple to matter.
Then pick one rung up and stay there until it's real. A store that fully lives at Stage 3 — measuring margin-per-foot and reallocating quarterly — will out-earn a store that has a fancy Stage 5 vocabulary but no discipline underneath it. Merchandising margin isn't won in a remodel. It's won in the quiet, repeatable habit of asking whether every foot of your floor is earning what it should, and having the numbers to answer.
If you're honest that you're at Stage 1 or 2, don't map out an 18-month transformation. Do the boring baseline first: draw your floor on one page, eyeball your category margins into a spreadsheet, and write down your markup bands as they actually are today. That single afternoon is the foundation every other rung sits on, and it's the step most stores skip because it feels too simple to matter.
Then pick one rung up and stay there until it's real. A store that fully lives at Stage 3 — measuring margin-per-foot and reallocating quarterly — will out-earn a store that has a fancy Stage 5 vocabulary but no discipline underneath it. Merchandising margin isn't won in a remodel. It's won in the quiet, repeatable habit of asking whether every foot of your floor is earning what it should, and having the numbers to answer.
Ready to elevate your hardware store management?
Join 500+ hardware stores using Hardzly to boost operational efficiency, reduce stockouts, and grow revenue.