


Most small hardware stores don't have a category problem. They have a governance problem. The plumbing wall grows because a rep talked someone into a new line three years ago. The fastener aisle shrinks because nobody wanted to touch it. Paint sundries creep sideways into an endzone that used to hold lawn stuff. Nothing is technically wrong, but nothing is deliberate either. The floor is the sum of a hundred small decisions nobody wrote down.
That's what category management actually is when you strip away the corporate language: a repeatable way to decide how much of your building each product family earns, and when you're allowed to change your mind. Not a one-time reset. A system that survives you being busy.
This post is about the connective tissue — how velocity bands, par formulas and margin-per-square-foot stop being three separate spreadsheets and start being one decision loop you run every year without drama.
Why the floor drifts (and why every store drifts the same way)
Walk any independent hardware store that's been open more than a decade and you'll see the same fingerprints. A category that's overweight relative to what it sells. A category that's quietly become the most profitable per foot and still gets the worst shelf.
The drift isn't random. It follows predictable pressure.
Space gets allocated by history, personality, and vendor pressure, in roughly that order. History means "it's always been there." Personality means the owner likes electrical, so electrical eats. Vendor pressure means whoever sends the most attentive rep gets the most linear feet, regardless of whether those feet pay.
None of those three inputs care about margin-per-square-foot. That's the whole problem. A store can look profitable on paper and still be quietly giving its best resource — the building — to categories that don't deserve it.
This matters more for a small store than a big-box for one simple reason: you don't have the square footage to hide a bad decision. A regional chain can carry a dead 4-foot section across 40 locations and average it out. You've got one store. Every wasted foot is a foot that a working category could've used.
The three numbers that have to talk to each other
Most advice treats velocity, par levels and margin-per-sqft as separate exercises. They're not. They're inputs to the same decision, and they only make sense together.
Stop losing sales due to inventory gaps.
Hardzly helps you manage stock levels, orders, and supplier interactions efficiently.
- Unified inventory and sales tracking
- Supplier and purchase order management
- Automated workflow and task scheduling
No credit card required
Velocity tells you how fast a category moves. Fast movers need depth and easy access. Slow movers need discipline or an exit. If you've already sorted your SKUs into velocity bands, you're halfway there — the SKU-velocity bands and shelf-space playbook covers the item-level mechanics that this article builds on at the category level.
Par formulas tell you how much you need on hand to avoid stockouts between deliveries. Get this wrong and fast movers go empty while slow movers pile up. The math for consumable categories — fasteners, adhesives, the stuff people buy by the handful — is worked through in the par-level formulas post, and those numbers feed directly into how much shelf a category actually needs versus how much it currently holds.
Margin-per-square-foot is the tiebreaker. It's the only metric that translates everything into the same unit: dollars earned per foot of building per year. A category can move fast and still lose the space argument if it moves fast at a terrible margin.
The formula itself is simple:
> Margin-per-sqft = (annual units × margin per unit) ÷ linear feet occupied
The insight isn't the formula. It's that you run it per category, side by side, once a year — and then you actually let the numbers drive reallocation. Most stores calculate it, nod, and change nothing.
A worked comparison across four hardware categories
Four categories a typical single-location store carries. Numbers are illustrative, but the relationships between them are what you'll recognize.
| Category | Annual units | Avg margin/unit | Linear ft | Annual margin | Margin/ft/yr | Velocity band |
|---|---|---|---|---|---|---|
| Fasteners (bulk + packaged) | ~14,000 | $1.10 | 24 | ~$15,400 | ~$640 | High |
| Power tool accessories | ~2,600 | $6.80 | 16 | ~$17,700 | ~$1,100 | Medium |
| Plumbing fittings | ~4,200 | $2.40 | 30 | ~$10,100 | ~$335 | Medium |
| Specialty electrical | ~900 | $9.50 | 20 | ~$8,550 | ~$425 | Low |
Look at what falls out. Fasteners feel like the workhorse — highest unit count by a mile — but they're mid-pack on margin-per-foot. Power tool accessories quietly earn the most per foot despite moving a fraction of the units, because margin per unit carries them. Plumbing fittings are the trap: 30 feet of prime space returning the lowest per-foot number in the group.
The knee-jerk move is "cut plumbing." That's usually wrong. Plumbing might be a destination category that pulls contractors in who then buy the high-margin stuff. Margin-per-sqft is a governance input, not an execution order. It tells you where to look, not what to do. That distinction is where most category resets go sideways — someone runs the numbers and starts cutting without asking why a category exists in the first place.
Building the tiering system
Once the three numbers are connected, you sort every category into a tier. Not items — categories. This is the layer above your SKU work.
Tier A — Protect and feed. High margin-per-foot, healthy velocity. These get first claim on space, best sightlines, deepest pars. In the table above, power tool accessories belong here. The rule for Tier A: never let it go empty, and give it room before anything else gets expanded.
Tier B — Hold and optimize. Solid performers doing their job. Fasteners usually land here — essential, high-touch, moderate return. You don't expand these, you tune them. This is where pack-size and order discipline matter most, because a lot of B-tier margin leaks through overbuying. If you're carrying more than your par math justifies, the MOQ and pack-size decision rules are what keep a B-tier category from quietly becoming a cash sink.
Tier C — Justify or shrink. Low margin-per-foot. Every C-tier category needs a written reason to keep its footage. Valid reasons: it's a traffic driver, it serves a contractor base, it completes a project basket. Invalid reasons: "we've always had it" and "the rep would be upset."
Tier D — Exit or minimize. Low velocity and low margin-per-foot and no strategic purpose. Specialty electrical in the example is a candidate — unless it's serving a specific customer segment, it's 20 feet that could be doing more.
Pro-tip: require a written justification for every C-tier category and review those justifications annually so drift can't hide behind "we've always had it."
The pattern worth naming: most stores have too many Tier C categories that have never been forced to justify themselves. C is where drift accumulates. Not dramatic enough to cut, not strong enough to grow, so it just sits. The whole point of tiering is to make C uncomfortable — to require a reason, every year.
The space budget: treating feet like money
Your linear footage is a fixed budget. Every foot given to one category is a foot taken from another. Once you frame it that way, "let's add a line" stops being free.
-
Measure your total sellable linear feet. Not aisles — actual merchandisable footage. Endcaps, walls, gondolas, everything.
-
Assign current footage to each category. Document reality first. Most owners are off by 15–20% on what they think a category holds versus what it actually holds.
-
Rank categories by margin-per-sqft and velocity band. This is your reality check against tier assignments.
-
Set a target footage per tier. Tier A gets a growth allowance, D gets a shrink target, and reclaimed feet get reassigned, not left empty.
-
Reconcile the difference. Where a category holds more feet than its tier justifies, that's your reallocation list.
The reconciliation step is where the fights happen and where the value lives. When plumbing holds 30 feet on a Tier C return and power tool accessories are jammed into 16 feet as your top per-foot earner, the budget makes the trade obvious in a way that eyeballing the floor never will.
One thing worth flagging: don't reallocate more than a couple of categories per cycle. Stores that blow up half the floor at once lose the ability to tell what actually moved the needle. Slow reallocation is legible. Big resets are noise.
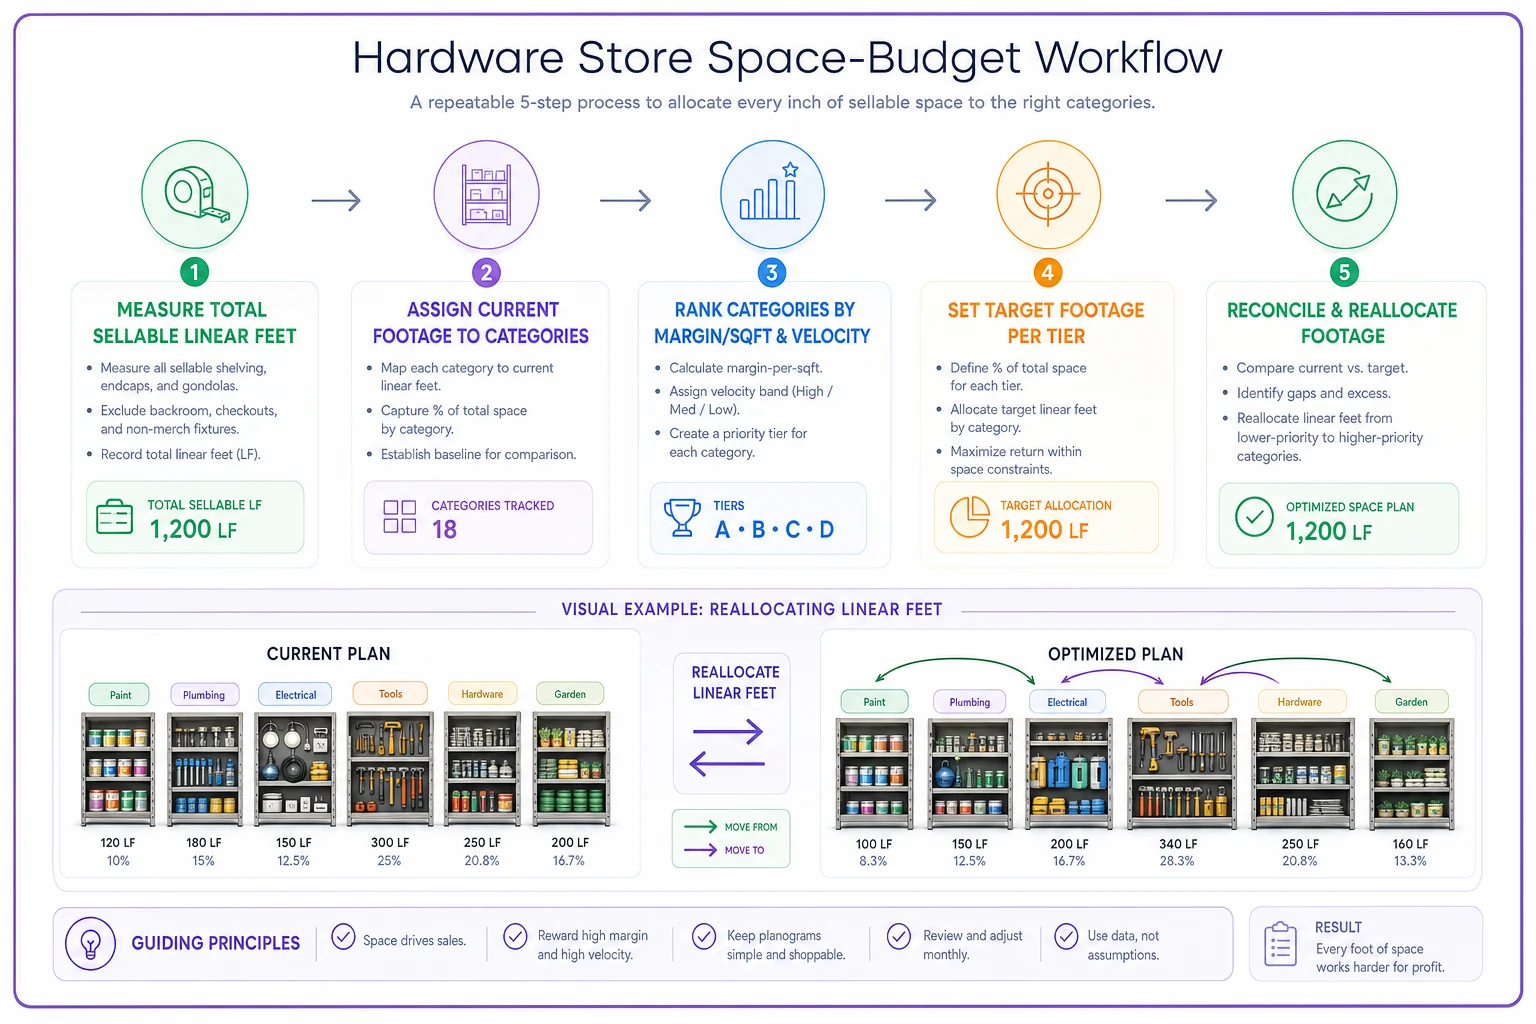
The reconciliation step is the procedural knot you pull on. Visualizing it as a workflow — measure, assign, rank, set targets, reconcile — makes the annual review feel like a repeatable process, not a wrestling match.
When this system makes sense — and when it doesn't
When it's worth it: You've got at least a dozen distinct categories, you're feeling space-constrained, and you can't clearly say which categories earn their footage. If you've ever added a line without removing one, you probably need governance.
When it's overkill: A very small store with a tight, curated assortment and an owner who knows every SKU cold probably doesn't need a formal annual review. Run the margin-per-foot math once to sanity-check, then move on.
Who should NOT start here: If your point-of-sale data is messy — categories mislabeled, units-of-measure inconsistent, vendor SKUs unmapped — fix that first. Category governance runs on clean data. The most common failure is running this playbook on numbers nobody actually trusts, then blaming the system when the reallocation flops.
Where the annual review usually breaks
The playbook is simple. Sticking to it isn't. The review fails in a handful of predictable places:
-
It never actually happens. Busy season arrives, the review slips, drift resumes. No calendar slot, no review.
-
The data gets pulled fresh each year with no baseline. Without last year's tier assignments to compare against, you can't see which categories improved or got worse.
-
Nobody owns the space budget. If reallocation is a group decision by committee, nothing moves. One person needs the pen.
-
Vendor relationships override the math. Rep pushback on shrinking a category is real, and it works, because there's a live human making the case and the spreadsheet isn't in the room.
-
Reclaimed space sits empty. You shrink a Tier D category and never assign the feet, so they get colonized by whatever's overstocked that week — and you're back to drift.
Behind all five: pulling velocity, par and margin data by hand quietly kills the whole effort. When running the annual review means three afternoons of exporting POS reports, matching vendor SKUs, and rebuilding a spreadsheet from scratch, it doesn't happen. Stores that keep category data flowing continuously — velocity bands updating, par levels recalculating, margin-per-foot visible per category without a manual export — are the ones that actually run the review on schedule, because the hard part is already done. The tooling isn't the strategy; it's what removes the excuse to skip the strategy.
A real scenario
A single-location store, roughly 6,500 sellable square feet, carried about 22 categories with no formal governance. The owner felt the floor was off but couldn't point to where.
Running the margin-per-foot math surfaced two things quickly. A seasonal lawn-and-garden extension held 34 feet year-round and earned close to nothing for eight months. Meanwhile, contractor-grade fasteners and power tool accessories — both strong per-foot earners — were cramped and stocking out on Fridays because their pars were set too low for the footage they'd been squeezed into.
The fix wasn't dramatic. They cut the off-season garden footage roughly in half, reassigned about 16 feet to the two stronger categories, and reset pars to match the new space. Over the following year, the two expanded categories saw noticeably fewer Friday stockouts, and the reclaimed feet stopped being dead weight for most of the year.
Nothing exploded. It just stopped leaking — which, for governance, is the whole win.
The instructive part: none of those numbers were hidden. They were sitting in the POS the entire time. What was missing wasn't data. It was a review that forced categories to compete for space on the same terms.
Making it repeatable
The difference between a one-time floor reset and a governance system comes down to two boring things: a date on the calendar and a saved baseline. Run the review the same time each year — ideally right after your slow season, before you commit spring orders. Save the tier assignments and the space budget. Next year, you're comparing, not rebuilding.
Category management for a small hardware store isn't about having the perfect assortment. It's about never again letting the floor drift for three years before anyone notices. Velocity tells you what moves, par tells you how much to hold, margin-per-foot tells you what the space is worth — and the annual review is the one moment you force all three to agree before touching a single shelf.
Get that loop running once, and the floor stops being an accident.
Ready to elevate your hardware store management?
Join 500+ hardware stores using Hardzly to boost operational efficiency, reduce stockouts, and grow revenue.