

Most merchandising "wins" in a hardware store are guesses wearing a confident face. You move the cordless drill demo to the endcap, attach rates feel like they go up, and three weeks later you can't actually tell if it helped or if you just had a good run of weekend contractors. The problem isn't that owners don't experiment — it's that they experiment sloppily, then trust gut feel to read the results.
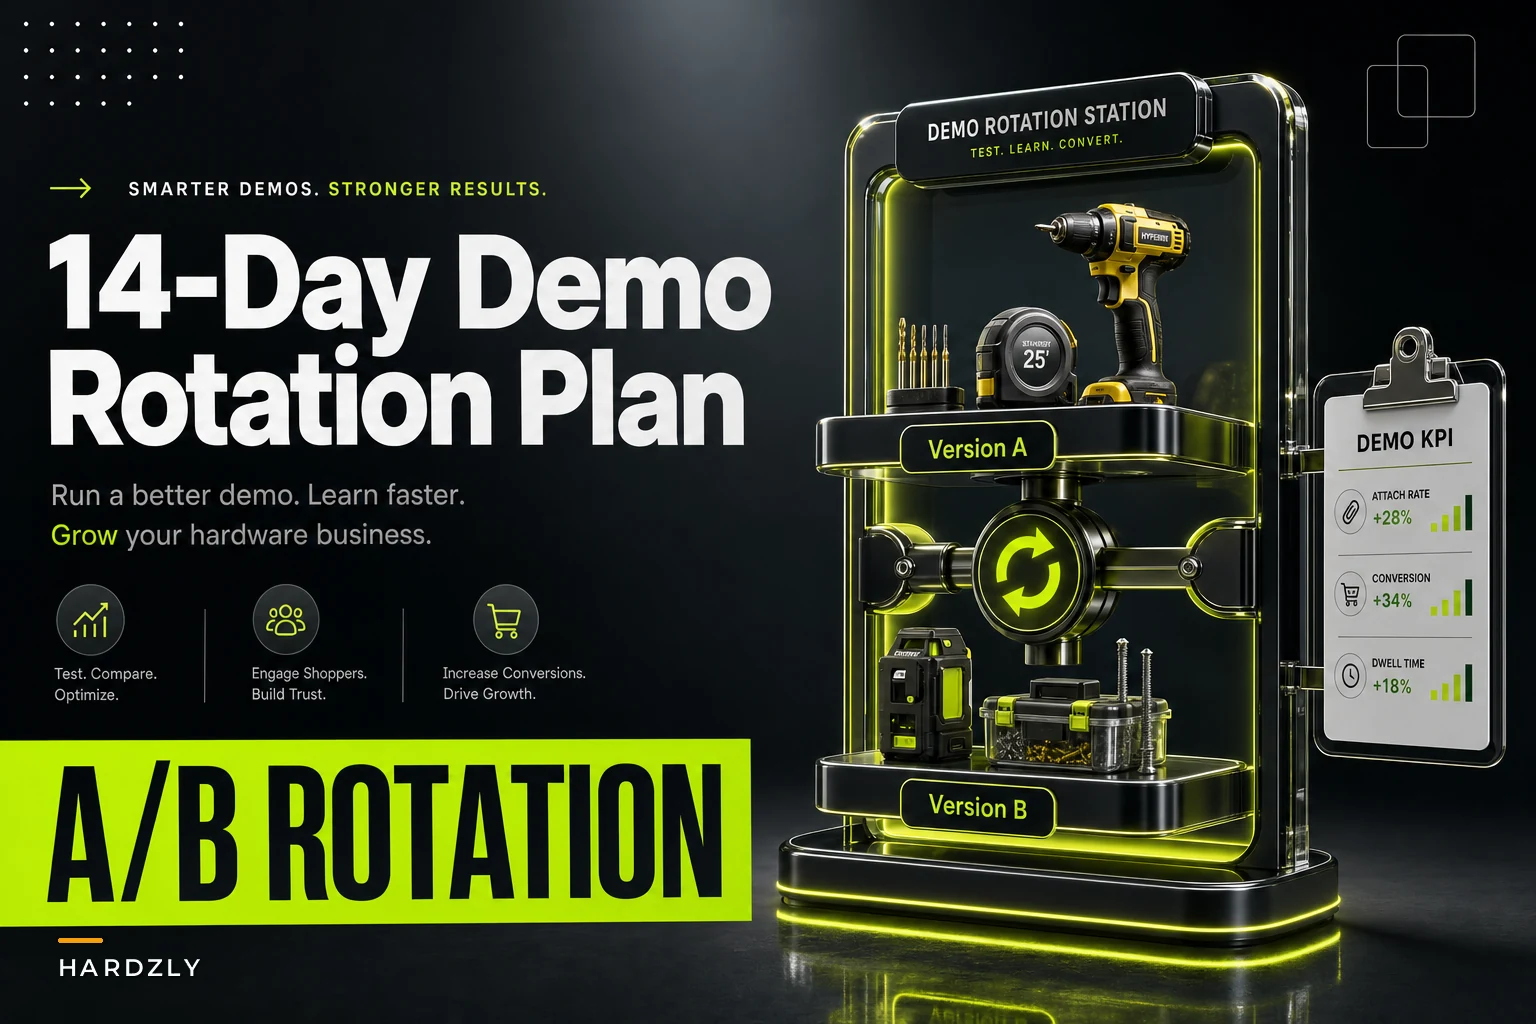
A 14-day demo rotation experiment fixes that. Short enough that you won't lose patience, structured enough that the numbers mean something, and light enough that your two-person weekend crew won't resent it. This post walks through exactly how to run one, what to track, and the go/no-go thresholds that tell you to keep a change or kill it.
Why 14 days, and why two steps
The two biggest mistakes with in-store testing are running too long and changing too much at once.
Run a test for a month and you've baked in a holiday, a weather swing, a contractor's bulk week, and a slow stretch — all tangled together. Run it for three days and random noise swamps any real signal. Fourteen days gives you two full weekend cycles plus the weekday mix, which is usually enough to see a pattern without dragging on.
The "two-step" part means you rotate the variable once, halfway through. Days 1–7 run Version A. Days 8–14 run Version B. Same display location, same demo product, same staff talking points — you only change the one thing you're testing. That rotation matters because it controls for the sneakiest bias in retail testing: the display that got the "good week" looks like the winner when it just got the good week.
A typical setup looks like this:
-
Version A (Days 1–7) Impact driver demo sitting flat on the fastener aisle endcap, no signage.
-
Version B (Days 8–14) Same impact driver, same endcap, now mounted upright on a demo stand with a "Try the trigger" tent card and the fastener bundle priced next to it.
One variable. One rotation. Everything else frozen.
The three KPIs that actually tell you something
You don't need a dashboard with 15 metrics. For a merchandising demo test, three numbers carry almost all the signal:
Stop losing sales due to inventory gaps.
Hardzly helps you manage stock levels, orders, and supplier interactions efficiently.
- Unified inventory and sales tracking
- Supplier and purchase order management
- Automated workflow and task scheduling
No credit card required
| KPI | What it measures | How you capture it |
|---|---|---|
| Attach rate | % of the demo product's buyers who also bought the linked item (e.g., driver + bit set/fasteners) | POS basket data on the tested SKU |
| Conversion | % of people who interacted with the demo and then bought the demo product | Manual tally sheet + POS unit sales |
| Dwell | Rough time/count of customers who stopped and touched the demo | Staff tick-mark tally, checked twice a day |
Attach rate is usually the money metric for hardware. A demo that sells one more drill a day is nice. A demo that lifts the attach rate on bits, blades, or fasteners is where the margin lives — those add-ons carry better margin-per-square-foot than the hero product itself. If you've worked through margin-per-sqft thinking across your categories, this is the floor-level version of the same idea.
Dwell is the softest of the three, and that's fine. You're not timing people with a stopwatch. You're having whoever's near the endcap drop a tick mark every time someone picks up the demo and holds it for more than a second. Rough is okay. Consistent is what matters — the same rough standard on Day 2 and Day 11.
The KPI sheet (keep it on paper first)
Resist the urge to build a spreadsheet masterpiece before you've run one of these. A clipboard at the counter works for round one. Here's the minimum:
Daily row, filled in at close:
-
Date / Version (A or B)
-
Demo-product units sold
-
Attach units sold (the linked item, same transactions)
-
Dwell tally (tick marks, total for the day)
-
Foot-traffic note (slow / normal / busy — one word)
-
Weather note (one word)
-
Anything weird (vendor visit, big contractor order, register down for an hour)
That "anything weird" column saves you more bad decisions than any fancy analytics. When you see a Day 9 that blew the doors off, you want to know a 40-unit deck-screw order walked in that afternoon before you credit the demo stand.
At the end of each 7-day block, total the columns and compute three things per version:
-
Attach rate = attach units ÷ demo-product units
-
Conversion proxy = demo-product units ÷ dwell tally
-
Dwell per day = total ticks ÷ 7
Keep an extra clipboard at the counter so you can spot-check tallies mid-week.
No regression, no p-values. You're looking for a clear, repeatable gap — not statistical perfection.
Go / no-go thresholds you set *before* you start
This is the step almost everyone skips, and it's the one that keeps you honest. Decide your win condition before you see the data, so you're not negotiating with yourself on Day 14.
-
GO (keep Version B) Attach rate improves by 5 points or more AND conversion proxy doesn't drop. Example: attach goes from 22% to 28%+, and you're still selling at least as many drills per dwell.
-
NO-GO (revert to A) Attach rate flat or down, or conversion drops noticeably while attach barely moves.
-
GRAY ZONE (re-run) Attach up 1–4 points, mixed conversion. Don't trust it. Either run the rotation again or call it a wash and move on.
Why a 5-point swing instead of "any improvement"? Small-sample retail data is noisy. A 1–2 point attach bump across 14 days could easily be random. A 5-point move that holds across both weekends is the kind of thing that usually survives when you scale it. The threshold protects you from acting on noise.
One adjustment worth noting: if your demo product is low-volume — say 3–5 units a day — widen your thresholds and stretch to 21 days. Small denominators make percentages jumpy. A store moving 25+ demo units a day can trust a 14-day read far more than one moving 4.
A real scenario
A single-location hardware store in a semi-rural town wanted to test whether a proper demo stand on their oscillating multi-tool moved the needle on blade attach.
Version A (flat display, no signage), week one:
-
~38 multi-tools sold
-
~9 blade packs attached → attach rate ~24%
-
Dwell tally averaged around 11 touches/day
Version B (upright stand + "feel the cut" card + blade pack clipped alongside), week two:
-
~41 multi-tools sold
-
~16 blade packs attached → attach rate ~39%
-
Dwell tally around 18 touches/day
Demo-product sales barely moved (38 vs 41 — basically noise). But the attach rate jumped 15 points, and it held across both the Saturday and Sunday of that second week, not just one good day. That cleared the GO threshold easily.
The owner rolled the format out to two more endcaps. Blades carry strong margin, so even a modest unit lift there was worth more than selling a few extra multi-tools. Nothing dramatic on the top line — but a steady, repeatable attach bump on a high-margin add-on is exactly what these tests are supposed to find.
Notice what made it trustworthy: demo-product count stayed flat. If drill sales had also jumped, you'd suspect the week was just busier overall. Flat hero sales + big attach lift = the display change probably did the work.
The 14-day run, step by step
Here's the full sequence so nobody has to improvise:
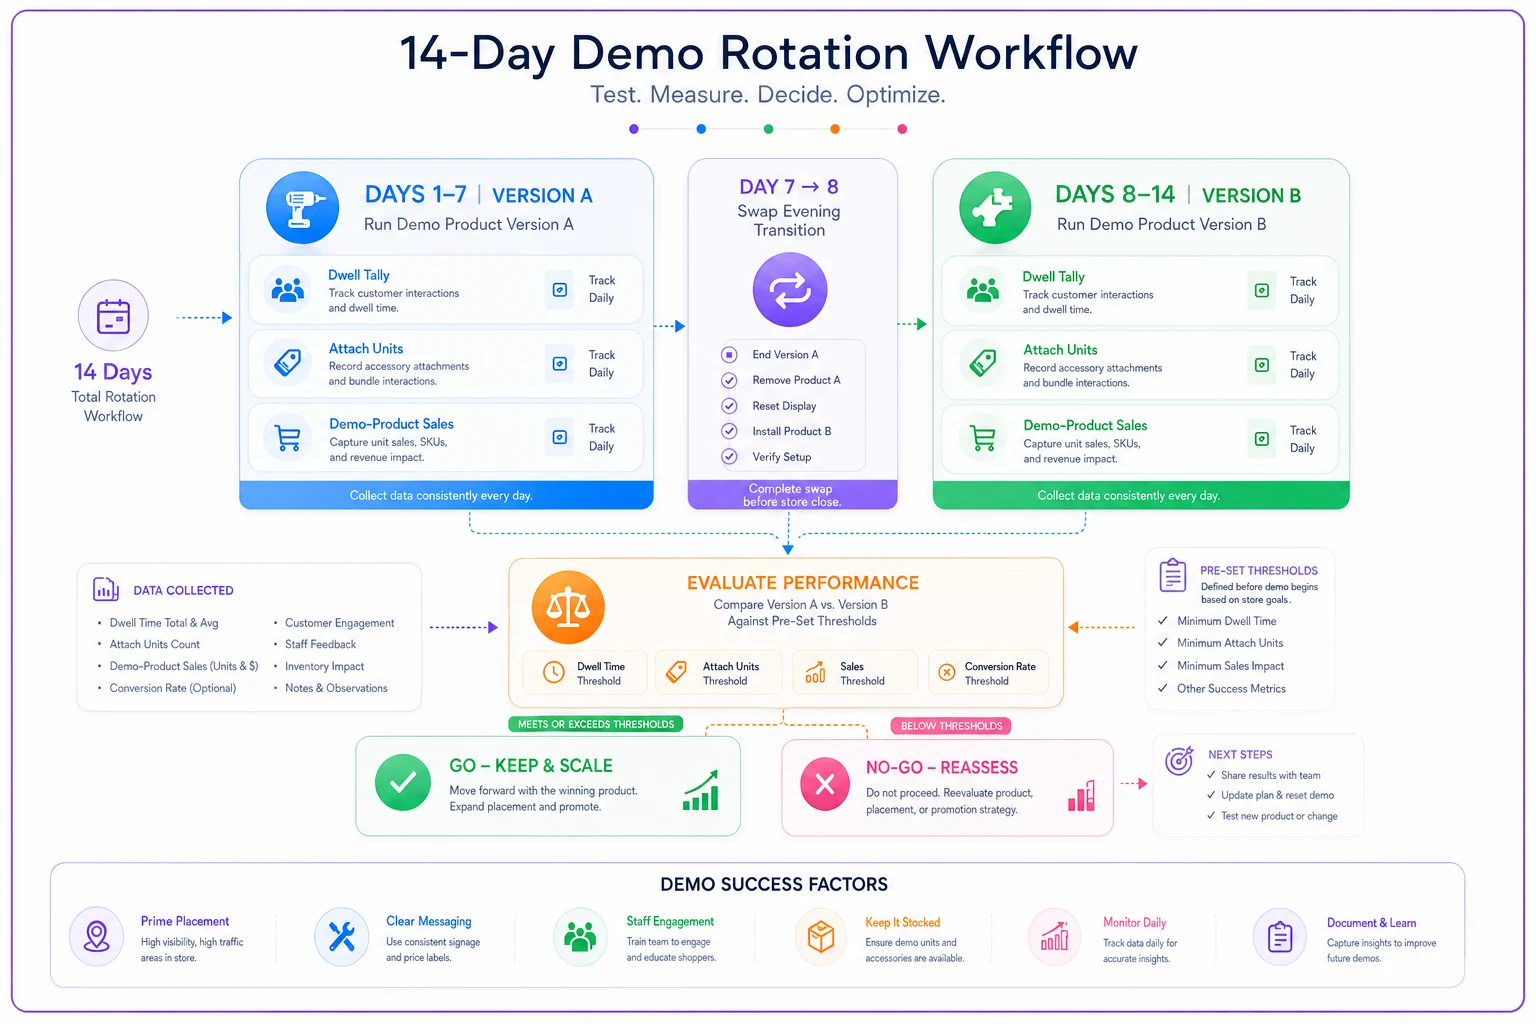
Visual guide to the rotation steps.
-
Pick one demo product and one linked item. Choose something with a natural attach and decent daily volume. Power tools + consumables are the obvious candidates.
-
Define Version A and Version B. Change exactly one thing — signage, mounting, bundle placement, pricing card. Pick one.
-
Write your thresholds down. GO / NO-GO / GRAY, with actual numbers, before Day 1.
-
Brief the floor team. Everyone needs the same dwell-tally standard and the same talking point. Script drift ruins the test.
-
Days 1–7, run A. Fill the sheet at close every night. No mid-week tweaks.
-
Day 7 evening
swap to B. Change only the tested variable. Reset nothing else.
-
Days 8–14, run B. Same discipline. Same tally standard.
-
Day 14
total both blocks, compute the three KPIs, compare to thresholds.
-
Decide
keep, revert, or re-run. Then document what you learned, even if it's "no difference."
That last point is underrated. A "no difference" result is still useful — it tells you not to spend time and signage budget on that change, and it frees the endcap for the next idea.
A quick pre-launch checklist
Before you flip to Day 1:
-
[ ] One variable, clearly defined for A and B
-
[ ] Demo product has enough daily volume (ideally 15+ units/day, or plan for 21 days)
-
[ ] Linked attach item is in stock for the full 14 days
-
[ ] Thresholds written down and visible to you
-
[ ] Floor team briefed on dwell tally + talking point
-
[ ] Paper KPI sheet printed and living at the counter
-
[ ] "Anything weird" column in use from Day 1
-
[ ] No competing promo or display change planned on that fixture for two weeks
That stock-availability line trips people up constantly. If your blade packs go out of stock on Day 10, Version B's attach rate craters for reasons that have nothing to do with the display, and you'll misread the whole test.
When this makes sense — and when it doesn't
Run this when:
-
You're deciding between two concrete merchandising options and want a real answer.
-
The demo product has steady, predictable volume.
-
You can keep the floor team consistent for two weeks.
Skip it or adjust when:
-
You're in peak-season chaos. Spring rush or snow-event weeks are too volatile — the weather and traffic swings will drown your signal. Test in a normal stretch.
-
The product sells a handful of units a week. The denominators are too small to trust; batch similar low-volume items or lengthen the window.
-
You're tempted to change three things at once. Then you're not testing — you're redecorating. Pick one variable or you'll never know what worked.
If you won't actually enforce the thresholds and will keep a change because you "feel" it works, the experiment is theater. The whole point is to let the numbers overrule the gut. If you've already decided the answer, don't bother with the two weeks.
Reading results without fooling yourself
A few patterns worth watching when you total everything up.
The display that ran during the better weather week often looks like the winner. Check your weather and traffic notes before you crown anything. If Version B's week was warmer and busier, discount its lead accordingly.
Watch for a conversion-vs-attach tradeoff. Sometimes a flashy display pulls more browsers (dwell up) but the same or fewer buyers (conversion flat or down) — you got attention, not intent. Attach can still climb because the buyers you do get are the serious ones. That's usually fine, but know which lever actually moved.
Don't over-rotate either. One clean 14-day test per fixture per month is plenty. Swapping demos every three days creates noise, not insight. The restraint is the method.
Once you've run a couple rounds on paper, folding attach and conversion into the same place you watch weekly sales signals keeps it from becoming a standalone chore. The 30-minute POS forecast dashboard setup is a natural place to park a recurring experiment KPI once the format proves itself.
The point of all this
A demo rotation experiment isn't about being scientific for its own sake. It's about spending your limited floor space and signage budget on changes that actually move attach and margin — and confidently ignoring the ones that don't.
Two weeks, one variable, three numbers, thresholds set in advance. That's the whole discipline.
Start with your single most-trafficked endcap and your highest-margin attach pairing. Run one clean rotation. Whether it's a GO or a NO-GO, you'll walk away knowing something real about your store instead of guessing — and the next test gets easier because you've already built the habit.
Ready to elevate your hardware store management?
Join 500+ hardware stores using Hardzly to boost operational efficiency, reduce stockouts, and grow revenue.