

Most hardware stores don't have a rental "business" or a service "business." What they actually have is a pile of loosely related revenue streams that grew one decision at a time. Somebody bought a floor sander because a contractor kept asking. Then a key machine. Then chain sharpening. Then propane exchange. Then a tiller for spring. Each one made sense on its own day. Nobody ever sat down and asked whether the whole collection was actually making money — or just moving cash around while quietly eating labor, floor space, and management attention.
That's the real problem with a service and rental revenue system for a hardware store: the individual pieces feel fine, but there's no shared way to see them. You can't compare the propane counter to the tiller rental to the blade sharpening bench because they're tracked — if they're tracked at all — in completely different ways. One lives in the POS as a SKU. One lives on a clipboard. One lives in the head of the guy who runs it on Saturdays.
This article is about pulling all of that into a single governance model — one intake flow, one pricing logic, a handful of shared utilization numbers, and a monthly service P&L that treats every line the same way. Not five spreadsheets. One system that tells you what's worth keeping.
Why these lines drift apart in the first place
Services and rentals fragment because they enter the store through different doors and never get reconciled.
A rental usually starts as an asset purchase — it hits your books as equipment, not inventory, and from that day forward it lives in a weird accounting no-man's-land. A counter service like key cutting or paint mixing starts as a labor-plus-consumables activity, so it either gets buried inside general payroll or gets no cost assigned at all. Sharpening might be tracked as a flat fee with actual bench time invisible. Propane and cylinder exchange often run almost entirely on vendor economics you don't fully see.
Because each line has a different "native format," nobody in the store can answer a simple question: which of these makes the most per hour of staff time and per square foot of floor? That's the only question that matters when you're deciding what to grow and what to kill.
Worth noting: the loudest service line is rarely the most profitable one. The tool rental that generates the most conversation — the one contractors ask about, the one staff enjoys running — is frequently a low-margin, high-hassle line that survives on emotion. Meanwhile the boring one (screen repair, key cutting, blade sharpening) quietly outperforms it and gets ignored because nobody's excited about it.
The governance model in plain terms
Governance sounds heavy. In practice it's four things applied consistently to every service and rental line:
Stop losing sales due to inventory gaps.
Hardzly helps you manage stock levels, orders, and supplier interactions efficiently.
- Unified inventory and sales tracking
- Supplier and purchase order management
- Automated workflow and task scheduling
No credit card required
-
A single intake workflow so every job — rental or service — gets logged the same way, with a customer, a promised-back time, and a price band applied at the counter.
-
Pricing bands so staff aren't inventing prices, and so every line has a floor you won't drop below.
-
A small set of utilization KPIs that work across both rentals and services.
-
A monthly service P&L that assigns real labor and real consumables to each line so you can see contribution, not just gross revenue.
The whole point is comparability. Once every line is measured the same way, decisions get obvious — which is exactly what you want.
Serialize rental assets first — you can't measure utilization or compare lines until each unit is identifiable.
Intake: one door for everything
The intake workflow is where most stores lose the thread. If a rental gets a paper contract, a sharpening job gets a sticky note, and a propane swap gets nothing, you have no shared record of what's out, what's promised, and what's overdue.
-
Who (customer name + phone, contractor account if applicable)
-
What (specific asset ID for rentals, service type for services)
-
When out / promised back (even services need a promised-ready time)
-
Deposit / hold taken
-
Price band applied
-
Who took it in (staff initials)
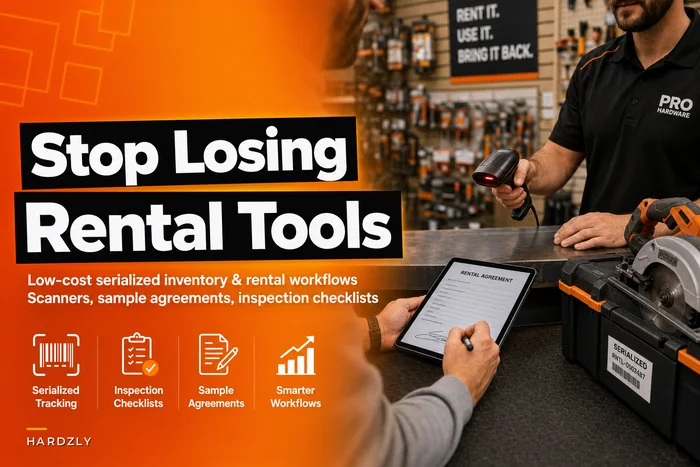
For rentals specifically, the asset needs to be a serialized, trackable item — not a generic "floor sander" line. If you haven't set that up yet, the mechanics of doing it cheaply are covered in this walkthrough on serialized rental inventory and workflows, and it's worth doing before you try to run utilization numbers, because you can't measure what you can't identify.
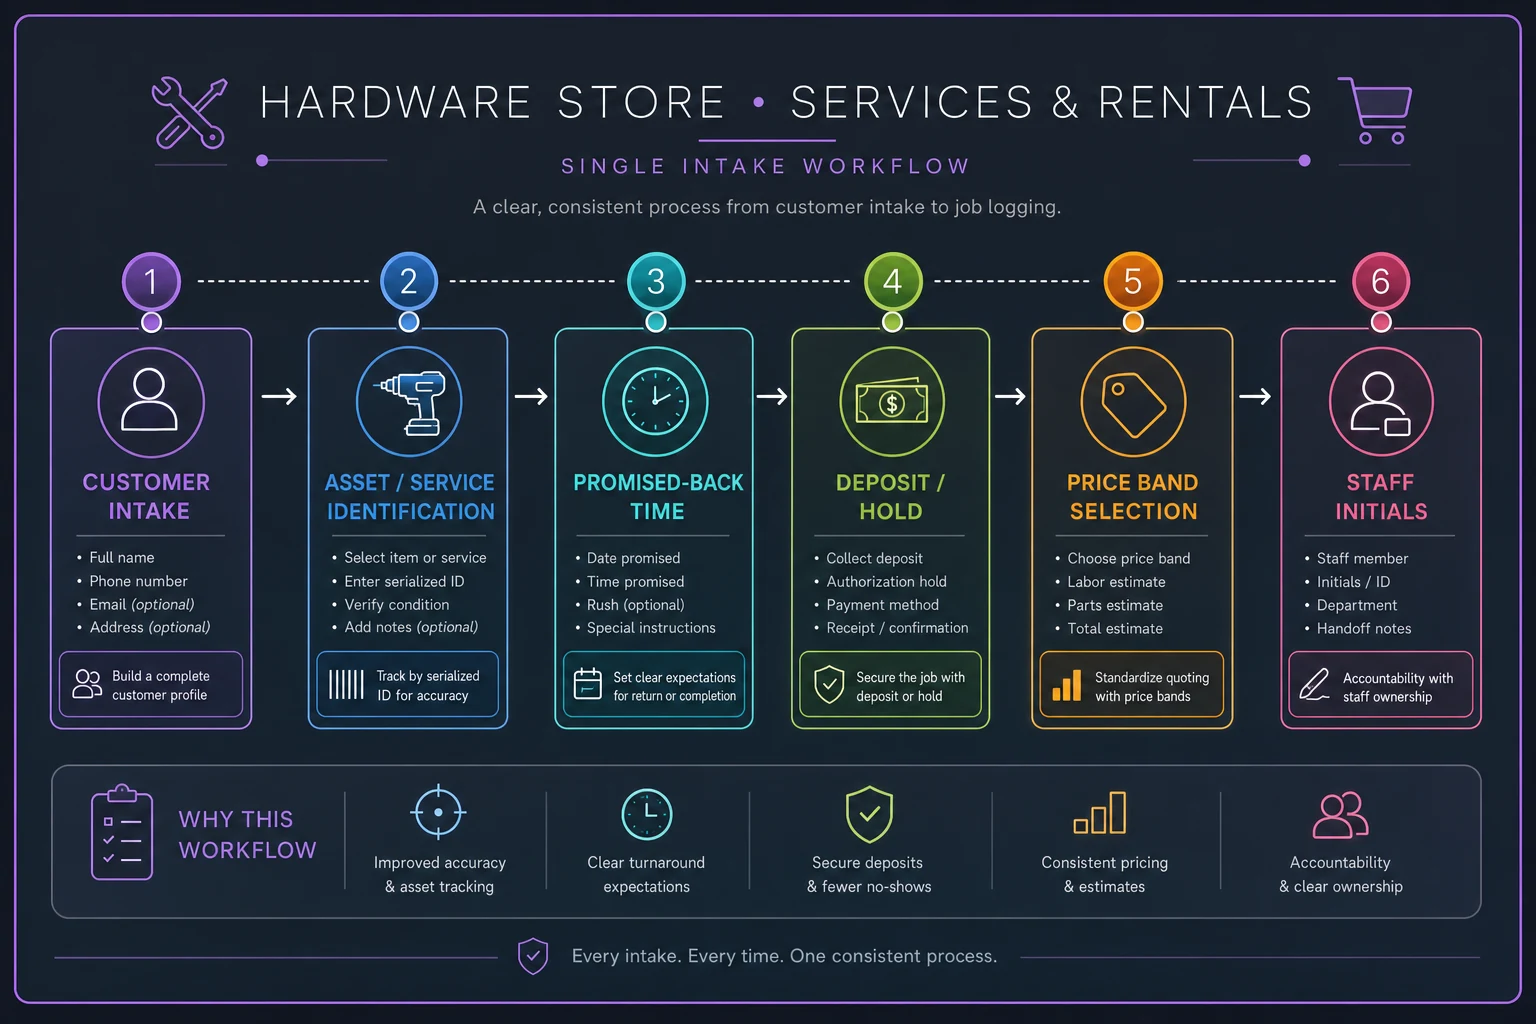
A simple visual like this keeps the counter steps consistent across staff and shifts.
Pricing bands that hold up under pressure
Flat per-item prices fall apart the moment a job is unusual. Bands give staff a defensible range and give you a floor.
A band has three anchors: a floor (never go below), a standard (default quote), and a premium (rush, oversized, or after-hours). The floor protects margin when a customer negotiates; the premium captures the jobs that actually cost you more.
Here's a simplified band structure across a few common lines. Numbers are illustrative — yours will shift with your labor cost and local market — but the structure is the point:
| Line | Floor | Standard | Premium (rush/oversize) | Costed on |
|---|---|---|---|---|
| Key cutting | $3 | $5 | $8 (specialty/auto) | consumables + counter min |
| Blade / chain sharpening | $8 | $12 | $20 (same-day) | bench time |
| Paint mixing/matching | free w/ paint | $6 (color match only) | $12 (rush match) | tinter + labor |
| Floor sander (day) | $45 | $60 | $85 (weekend/holiday) | asset depreciation + prep |
| Tiller (day) | $55 | $75 | $100 (weekend) | asset + fuel + cleaning |
| Propane exchange | vendor floor | standard | — | vendor spread |
The mistake stores make with pricing isn't setting it too low once — it's never revisiting it. A sharpening price set three years ago doesn't reflect today's labor. A rental day rate set when the sander was new doesn't account for what it's now costing in repairs. Bands should get a quick review whenever labor cost moves or an asset crosses into its high-maintenance years.
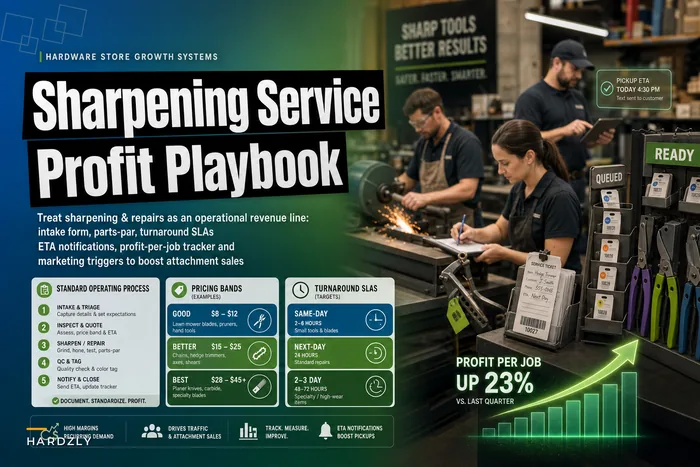
If you're building service pricing from scratch, the turnaround-and-band logic in the tool sharpening service playbook is a solid template to copy the structure from and adapt to your other lines.
The utilization KPIs that actually matter
You don't need a dashboard with twenty metrics. Across both rentals and services, four numbers tell you almost everything.
1. Utilization rate (rentals). Days rented ÷ days available. A floor sander that rents 6 days a month is at roughly 20% utilization. Below about 15–20% for a full month, that asset is usually a floor-space liability unless it's a loss-leader pulling in consumable sales like sandpaper or rental-tied supplies.
2. Revenue per available day (rentals). Utilization alone can mislead you — a cheap tool rented constantly can still lose to an expensive tool rented occasionally. Revenue per available day normalizes that. It's the number that tells you whether to buy a second unit.
3. Service throughput per labor hour. For counter services, this is revenue divided by the actual staff minutes the line consumes. Key cutting looks tiny per job but can be extremely high per labor hour because each job takes ninety seconds. Sharpening looks lucrative per job but eats bench time.
4. Overdue / exception rate. The percentage of rentals returned late or services that missed their promised-ready time. This one predicts problems before the P&L does. A creeping overdue rate means your intake and follow-up are leaking, and leaked rentals eventually become lost assets.
A subtle point people miss: utilization and throughput pull in opposite directions when staff is the bottleneck. Push sharpening volume up and you can starve the counter of the labor that runs the high-throughput services. These KPIs only make sense read together, not one at a time.
Building the monthly service P&L
This is the piece that turns a pile of activities into a managed profit center. The trick is assigning real costs — especially labor — instead of only looking at revenue.
-
Revenue — straight from intake logs / POS
-
Direct consumables — key blanks, sandpaper, tinter, propane spread, replacement parts
-
Direct labor — estimated staff minutes × loaded hourly rate
-
Asset cost (rentals) — monthly depreciation + repairs allocated to that unit
-
Contribution — what's left, and the only number worth comparing across lines
A worked example
Take a single-location store looking at three lines for one month.
Key cutting. About 210 keys cut. Revenue roughly $1,050. Blanks and machine wear maybe $180. Labor is the surprise — 210 keys at ~90 seconds each is around 5 hours of counter time, call it $110 loaded. Contribution lands near $760. Almost no floor space, almost no risk. Quietly excellent.
Floor sander rental. Rented 7 days at $60, one weekend at premium — around $520 revenue. Depreciation and repairs allocated at about $140 for the month, prep/cleaning labor maybe $90, plus a botched return that needed new sanding pads. Contribution around $260. Fine, not thrilling — and it's occupying real back-room space.
Blade sharpening. Around 40 jobs at $12 standard, a few rush jobs — call it $540. Consumables light, maybe $40. But bench time is real: 40 jobs at ~15 minutes is 10 hours, roughly $220 loaded. Contribution near $280.
Now line them up. Key cutting throws off nearly triple the contribution of either "bigger" line, on a fraction of the labor and none of the space. If you were deciding where to add capacity, the boring line wins — and without a shared P&L you'd never have seen it, because in raw revenue the sander and sharpening look like the important ones.
That inversion — where the least glamorous line is the profit engine — shows up constantly once you actually cost the labor. It's the single biggest reason this consolidation is worth the effort.
SLA templates: the promises that keep it from unraveling
Services and rentals both run on promises: back by Tuesday, ready by 4, deposit refunded on clean return. When those promises are informal, they get broken, and broken promises are where both customers and margin leak.
-
Rental return SLA Promised-back time is logged at intake. A reminder goes out the morning it's due. Grace of a few hours, then the late-day rate applies automatically. Overdue beyond 24 hours triggers a phone call, not a note-to-self.
-
Service turnaround SLA Every service line gets a standard turnaround (same-day, next-day, 48-hour) and a rush option that maps to the premium price band. The promised-ready time is written on the intake ticket and on the customer's copy.
-
Deposit / condition SLA Deposit amount, what counts as "returned clean/complete," and how fast the deposit clears back. Ambiguity here is where arguments start.
The point of writing these down isn't bureaucracy. It's that consistent promises let anyone on staff run the counter the same way — which is exactly what breaks when the one person who "knows how the rentals work" is off that day.
When this consolidation makes sense — and when it doesn't
It makes sense when you've got at least three or four active service/rental lines and you genuinely can't say which one earns the most per labor hour. If that question makes you reach for a guess, you need the shared model.
It also makes sense when you're about to invest — a second rental unit, a new sharpening setup, a hire to run the counter. Making that call on gut instead of contribution numbers is how stores end up with a $2,000 machine that rents four times a year.
It's a bad idea when your service revenue is genuinely tiny and stable — one occasional rental and nothing else. Building governance around $150 a month of activity is over-engineering. Track it loosely and move on.
Who should not do this yet: a store that hasn't serialized its rental assets or standardized intake. You can't govern what you can't see. Fix the identification and logging first, then layer the P&L and KPIs on top. Doing it in the wrong order produces a very organized system built on unreliable data.
What changes as you grow
At one location with a couple of service lines, all of this can live in a well-built spreadsheet reviewed monthly. The intake log, the pricing bands, the KPIs, and the P&L fit on a few tabs, and the owner holds most of the context in their head anyway.
The breaking point comes with volume and staff. Once multiple people are taking in rentals and running services across different shifts, the manual version starts leaking — tickets don't get logged, promised-back times live only on paper, overdue rentals aren't caught until someone notices the shelf is empty. This is when an operational platform that ties intake, asset tracking, promised-back reminders, and the monthly rollup into one place stops being a nice-to-have. The value isn't the software for its own sake — it's that the governance model actually gets followed when logging a job and applying a band is the path of least resistance instead of an extra chore.
But the sequence matters. Build the intake standard, the bands, the KPIs, and the monthly P&L on paper until they're real. Whatever you use to run it — spreadsheet or platform — should serve that model, not replace the thinking behind it.
The takeaway
Treating counter services and rentals as one governed profit center — instead of five side hustles nobody fully owns — is what turns them from a distraction into a real, measurable part of the store. The mechanics aren't complicated: log everything the same way, price in bands, watch four KPIs, and cost the labor honestly in a monthly P&L. What's hard is the discipline to do it consistently, and the willingness to act on what the numbers show even when they contradict which lines feel important.
Do it, and you'll usually find at least one quiet line carrying far more weight than you thought, and at least one loud line worth shrinking or dropping. Both of those discoveries pay for the whole effort.
Treating counter services and rentals as one governed profit center — instead of five side hustles nobody fully owns — is what turns them from a distraction into a real, measurable part of the store. The mechanics aren't complicated: log everything the same way, price in bands, watch four KPIs, and cost the labor honestly in a monthly P&L. What's hard is the discipline to do it consistently, and the willingness to act on what the numbers show even when they contradict which lines feel important.
Do it, and you'll usually find at least one quiet line carrying far more weight than you thought, and at least one loud line worth shrinking or dropping. Both of those discoveries pay for the whole effort.
Ready to elevate your hardware store management?
Join 500+ hardware stores using Hardzly to boost operational efficiency, reduce stockouts, and grow revenue.