


Most hardware store owners find out about a cash problem the same way: a supplier card gets declined, payroll runs short by Thursday, or the accountant calls mid-month sounding worried. By then you're not making decisions — you're reacting. And reacting costs money. You take the bad payment terms, you sell margin to move cash, you skip an order you actually needed.
The frustrating part is that almost every one of those surprises was visible two to four weeks earlier. The signals were sitting in your POS and your bank account. Nobody had a routine to look at them.
That's what this is. A tight, one-hour weekly financial routine built for a small hardware store owner who doesn't have accounting staff and doesn't want to become an accountant. Ten things you look at, eight of them numbers, plus a simple decision layer that tells you what to do when something goes sideways. I call it the Owner-10 because it fits in one sitting and it's yours — not something you delegate and forget about.
Why weekly, and why the owner
Monthly financials are autopsies. They tell you what killed the month after it's dead. Cash problems in a hardware store move faster than that — a slow week plus a big inventory receipt plus payroll landing on the wrong day can flip you from comfortable to scrambling inside ten days.
There's also a coordination problem that shows up as stores grow. When it's just you, the numbers live in your head. You feel when a week was soft. Add a second cashier, a receiving person, a bookkeeper who comes in twice a month, and suddenly nobody owns the whole picture. Receiving knows what's coming in. The bookkeeper knows what's going out. You know what sold. Nobody's holding all three at once.
The Owner-10 exists to be that one place where all three meet, every week, in your hands. Not because employees can't be trusted — because cash risk lives in the gaps between their jobs, and only the owner sits above all of them.
The eight KPI checks
These are the eight numbers. The point isn't precision to the penny — it's direction and trend. You're looking for something moving the wrong way, not building a financial statement.
Stop losing sales due to inventory gaps.
Hardzly helps you manage stock levels, orders, and supplier interactions efficiently.
- Unified inventory and sales tracking
- Supplier and purchase order management
- Automated workflow and task scheduling
No credit card required
| # | KPI | Where it comes from | What "fine" looks like | Red flag |
|---|---|---|---|---|
| 1 | Cash on hand vs. next 14 days of committed spend | Bank balance + known bills/payroll | Balance covers 2+ payroll cycles | Balance < one payroll + rent |
| 2 | Weekly sales vs. same week last year | POS | Within normal seasonal swing | Down 15%+ two weeks running |
| 3 | Blended gross margin % | POS margin report | Steady inside 1–2 pts | Slipping 3+ pts with no promo reason |
| 4 | Payables due next 14 days | AP list / supplier statements | Spread out, matches incoming cash | Bunched up in one week |
| 5 | Payroll as % of weekly sales | Payroll + POS | Stable for your model | Rising while sales flat/falling |
| 6 | AR / contractor account balance overdue | POS or account ledger | Under your credit limit total | One account creeping past 60 days |
| 7 | Inventory receipts landing this week | Receiving / open POs | Matches what you planned to buy | Big unplanned receipt hitting a tight week |
| 8 | Fast-mover stock position | POS velocity report | Top sellers in stock | Top 20 SKUs going thin |
KPI 1 is the whole game. Everything else is early warning; this one is the alarm. Look at your actual bank balance, then subtract everything you know is leaving in the next two weeks — payroll, rent, the supplier payments you've already committed to. If that number gets uncomfortable, you're in decision mode regardless of what the other seven say.
KPI 3 (margin) hides more damage than any other line. A store can post flat sales and quietly bleed. The usual culprits: a vendor cost increase you passed through slowly, too many contractor-discount rings, or shrink you haven't caught. Margin drifting down 3 points on $30k of weekly sales is roughly $900 gone every week — nearly $4k a month — and it never shows up as a dramatic event. It just drips.
KPI 5 (payroll %) is the one owners underweight. You schedule for the store you want to have, not the traffic you're actually getting. When sales soften and the schedule doesn't move with them, payroll percentage climbs and eats the cushion you'd normally use to pay suppliers. It feels unavoidable in the moment. It isn't.
If you already run a lightweight sales dashboard, several of these — sales trend, margin, fast-mover position — overlap with what you'd track there. The 30-minute POS forecast dashboard pairs naturally with this routine so you're not pulling the same numbers twice.
The two checks that aren't numbers
Check 9 — The "what changed" scan. Two minutes. Did anything shift this week that the numbers won't show yet? A supplier announced a price increase for next month. A big contractor account went quiet. A staff member gave notice. A competitor down the road closed or opened. These don't hit your KPIs today but they will, and catching them now buys you weeks of lead time.
Check 10 — The gut-vs-numbers reconciliation. Ask yourself: does the story the numbers are telling match how the week felt? When your gut says "that was a strong week" and the sales line says otherwise, one of them is wrong. Usually it's worth thirty seconds to figure out which. Sometimes it's a POS category miscoded. Sometimes it's that you're remembering the busy Saturday and forgetting the dead Tuesday and Wednesday. This check catches data problems and self-deception in about equal measure.
Decision triggers: turning a bad number into an action
A number moving the wrong way is useless without a rule attached to it. The mistake owners make is treating every soft week as either a crisis or nothing. You need tiers.
-
Green — everything inside normal ranges. Log the numbers and move on. The trend matters more than any single week.
-
Yellow — one or two KPIs flagging, cash still covers 2+ payroll cycles. Watch and adjust. Tighten the schedule slightly. Slow one non-urgent PO. Nothing dramatic — small corrections early prevent bigger ones later.
-
Orange — cash covers less than 2 payroll cycles, OR margin/payroll trending wrong for 2+ weeks. Now you're actively managing cash. The prioritized action list below kicks in here.
-
Red — cash won't cover next payroll plus rent, or a payment is about to bounce. Everything discretionary stops today.
The value of naming the tiers is that it removes the emotional guessing. You're not asking "should I be worried?" every week. You're checking which tier you're in and running the matching playbook.
Prioritized actions when cash gets tight
When you hit Orange or Red, the instinct is to grab the first lever you see — usually a fire-sale promo to pull cash forward. That's often the worst first move because it trades margin you can't get back. Here's the order that protects the business best.
First: fix payables timing before you touch anything else. Most cash crunches aren't a money problem, they're a timing problem. You have the money coming, it's just landing after the bill is due. Call your two or three largest suppliers and ask to move a due date by a week or ten days. Established suppliers do this far more often than owners expect — they'd rather wait ten days than lose the account. Reordering when money leaves costs you nothing in margin.
Second: pause discretionary and unplanned inventory buys. Any PO that isn't for a fast-mover or a committed contractor job gets held. Not cancelled — held. The line between "need it now" and "nice to have" is where most stores overspend cash without realizing it. Your fast-mover check (KPI 8) tells you what genuinely can't wait.
Third: emergency labor cuts, done honestly. If payroll % is the problem, the schedule has to move. Trim the hours that don't touch the door or the register first — extra receiving time, overlapping shifts, the Tuesday-afternoon third person. Protect coverage during your actual busy hours. Cutting the wrong hours costs you sales and makes the cash problem worse.
Last, and only if the first three aren't enough: promo holds and margin moves. The first promo action in a cash crunch is often a hold, not a launch. If you've got a planned discount event coming up, pausing it keeps margin dollars in the building. Only after that do you consider a targeted, short promo to move slow stock into cash — and even then, aged inventory only, never your fast movers.
This order matters because each step earlier in the list preserves more future profit than the one after it. Timing costs nothing. Holding inventory costs a little. Cutting labor costs some flexibility. Selling margin costs actual money you'll never recover. Owners who reverse this — promo first — end up thinner every crunch.
For the deeper mechanics on how inventory purchases and supplier payments tie back to your cash cycle, the inventory-to-cash playbook walks through the reconciliation and payment cadence side in detail.
The one-sheet cash-risk heatmap
This is the artifact that makes the whole routine stick. One page. You should be able to glance at it and know your risk level in about five seconds.
-
Green — inside normal range
-
Yellow — drifting, worth watching
-
Red — flagged, action required
The heatmap does something no single number can: it shows clustering. One yellow cell is noise. Three yellow cells appearing in the same week — soft sales, rising payroll %, bunched payables — is a pattern, and patterns are what actually sink stores. A crunch is almost never one thing going wrong. It's three ordinary things lining up in the same two weeks.
-
- [ ] One row per KPI (the eight above)
-
- [ ] One column per week, oldest on the left
-
- [ ] Simple color rule you define once and don't renegotiate weekly
-
- [ ] Cash-on-hand row always at the top — it's your alarm line
-
- [ ] A short notes cell at the bottom for Checks 9 and 10
-
- [ ] Keep 8–12 weeks visible so trends and clustering show
-
- [ ] File it somewhere you'll actually open — same place, every week
You can run this in a spreadsheet, and plenty of owners do. If your POS or store management platform already pulls sales, margin, and inventory velocity, feeding those numbers straight into the sheet cuts your prep time and removes the retyping errors that make people quit the routine after a month. The goal isn't fancy software — it's that pulling the numbers should take a few minutes, not half your hour, so the routine survives past week three.
File it somewhere you'll actually open — same place, every week
Here's a quick visual of the weekly routine.
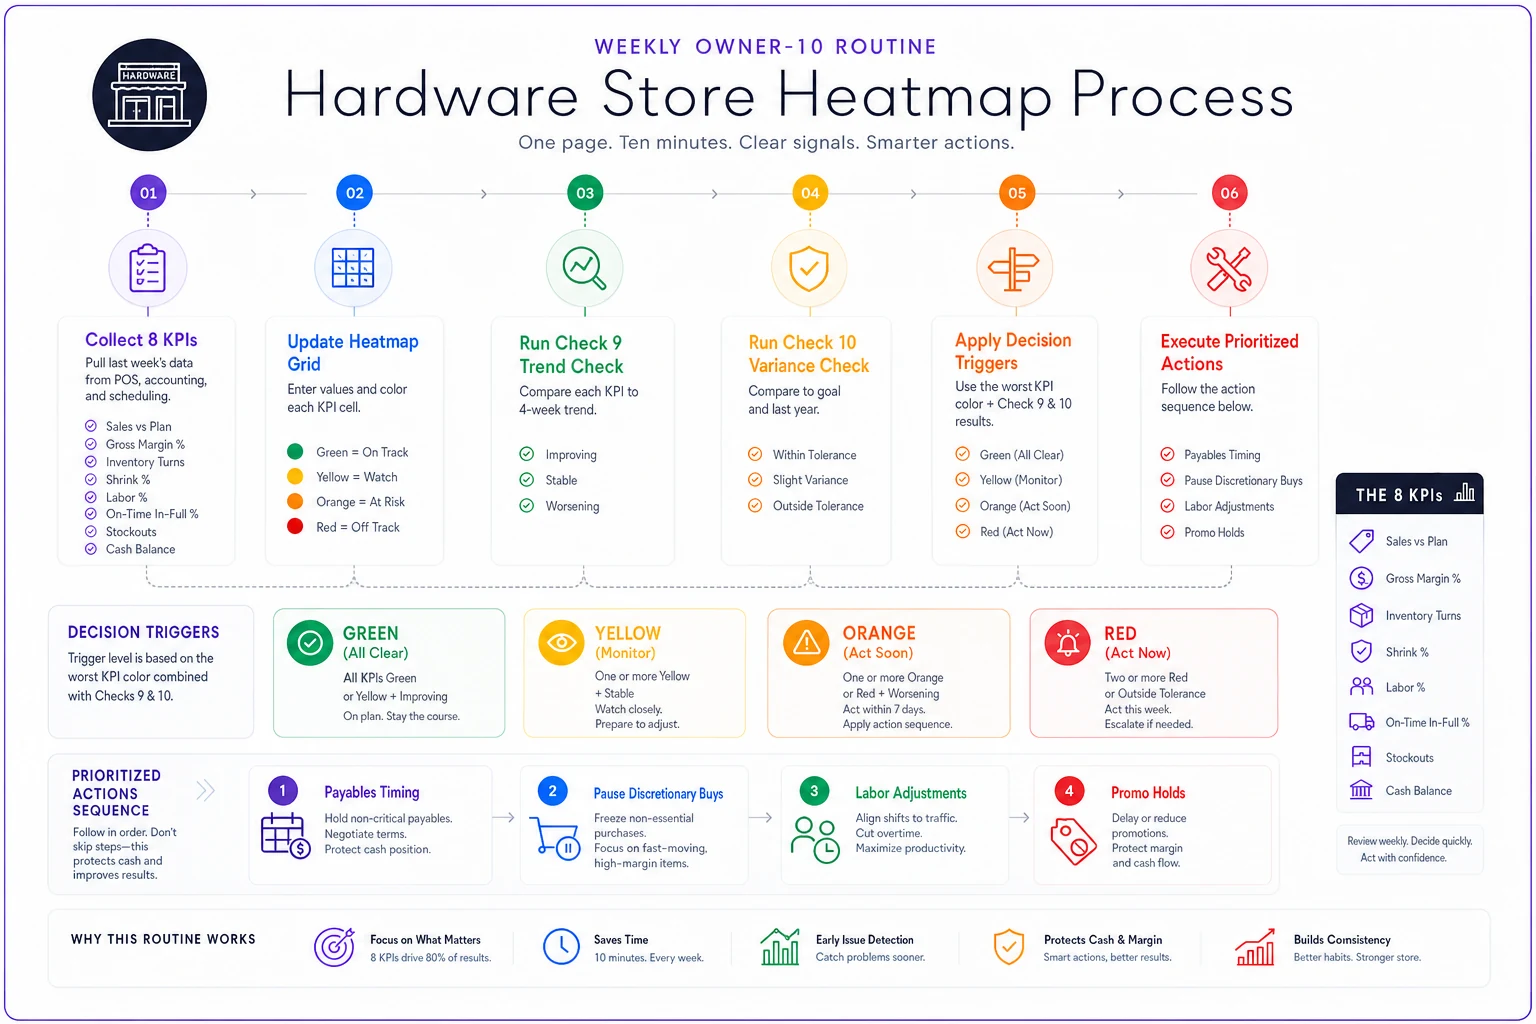
Keep the last eight to twelve weeks visible side by side. When you can see that margin has been quietly yellow for a month while you were focused on sales, the picture tells you where to look. A single week's snapshot would have missed it entirely.
When this routine makes sense — and when it doesn't
It makes sense when you're a single-location or small-multi store without a controller, where the owner is close enough to operations to know what the numbers mean, not just what they say. If cash timing has surprised you even once in the last year, this was built for you.
It's overkill when you already have a real finance function running weekly cash forecasts and a controller who owns AP timing. At that point the Owner-10 becomes redundant with work someone's already doing well — though even then, a ten-minute heatmap review keeps you connected to the picture.
Who should NOT rely on this alone: if your books are genuinely a mess — bank not reconciled, AP unknown, POS margins wrong — this routine will just show you garbage faster. Clean up the underlying data first. The Owner-10 is a monitoring layer. It assumes the numbers it's watching are roughly right.
A real scenario
Single-location hardware store, roughly $1.6M in annual sales, two full-timers and a couple of part-timers. No accounting staff — the owner did a monthly review with an outside bookkeeper and otherwise ran on feel.
The pattern that kept biting them: every few months, a bunch of supplier payments and payroll would land in the same week, the balance would get scary, and they'd float it on the business card at a cost. They also had a contractor account that had quietly drifted to around $6k, sixty-plus days out, without anyone flagging it.
They started running a version of the Owner-10 on Sunday nights. Nothing sophisticated — a spreadsheet heatmap, fifteen minutes pulling POS numbers, the rest judgment. Within the first month the payables-timing check caught a bunching week early; two supplier calls moved due dates and they skipped the card float entirely. The overdue contractor balance showed up red on the AR row and got the phone call it had needed for weeks — most of it collected inside the next cycle.
The bigger shift wasn't any single save. It was that soft weeks stopped being surprises. When sales dipped, the schedule got trimmed the same week instead of a month later after the payroll percentage had already done its damage. Over a couple of quarters that consistency was worth more than any one avoided crunch — a few thousand dollars in card fees and recovered margin they'd have otherwise leaked, plus a lot less Thursday-morning stress.
How this connects to everything else you're already tracking
The Owner-10 isn't a standalone chore — it's the financial layer sitting on top of the operational routines you probably already run. Your reorder decisions feed KPI 7 and 8. Your promo calendar feeds the margin and cash checks. Your seasonal planning determines whether a heavy inventory receipt week is going to collide with a soft sales week.
That last one is where a lot of avoidable crunches come from — buying deep for a season right as the cash cycle tightens. Tying your buying rhythm to your cash rhythm is exactly what the seasonal forecasting and cashflow routine is built to prevent, and it feeds directly into KPIs 4 and 7 here.
The point of pulling them together weekly is coordination. Individually, each routine is fine. The failures happen in the seams — receiving buys deep the same week payroll lands and a slow stretch hits. No single system catches that collision. The heatmap does, because it puts all three in front of you at once.
You don't need accounting staff to stay ahead of cash risk. You need one hour, ten checks, a decision rule that tells you what to do when a number turns, and a one-page heatmap that shows you trouble clustering before it becomes a crisis.
The stores that get blindsided aren't worse operators. They're just running blind between monthly statements, making decent daily decisions with no weekly view of where the cash is actually going. Close that gap with an hour on Sunday, and most of the surprises stop being surprises. The decisions get calmer, cheaper, and earlier — which is really the whole point.
Ready to elevate your hardware store management?
Join 500+ hardware stores using Hardzly to boost operational efficiency, reduce stockouts, and grow revenue.